







Interactive Stock Charts

Descrizione di Interactive Stock Charts
Annoucement: v2.81 includes new data source for AlphaVantage for international market data.
New!! Candlestick Pattern Scanner and Indicator Reliability Lab added to allow Instant backtesting!
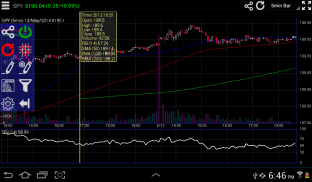
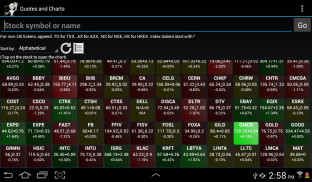
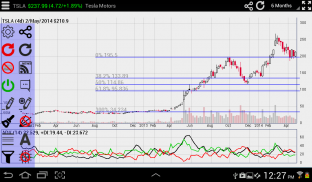
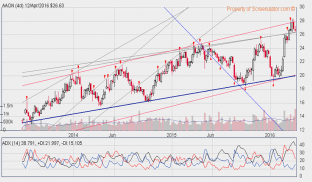
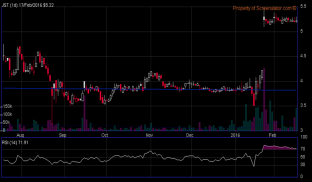
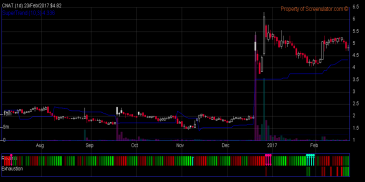
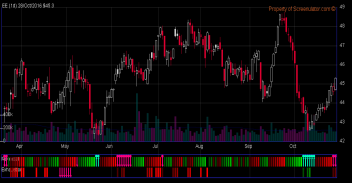
Interactive Stock Charts © is the most intuitive and advanced stock analysis charting app. You can freely adjust time frame and view technical information with touch of finger: scroll, pan and zoom on a beautiful candlestick charts with gesture and touch control. Swipe to scroll into historical analysis, pinch to zoom and change time frame, touch on price points to show detailed quotes and technical indicator values. You can also place real trade orders directly from the charts and portfolio view, through our partner Tradier Brokerage for US equity and options. Backed by Screenulator's patent pending automated chart pattern and trendline recognition engine, and industry's first 9,13 indicator completion screener! Interactive Stock Charts also comes with a powerful technical analysis tool set, Indicator Reliability Lab - in-chart backtesting tool and realtime RSS news feed to give you an edge over the market!
Using AI-based Deep Learning Neural Networks algorithms, Screenulator detects highly proftable chart patterns and reliable trendlines, TR/TD Indicators signals, as well as candlestick patterns. Backtested with 50+ years of historical big data, it ensures the you always have an edge against increasingly unpredictable markets! All Screenulator chart patterns are available on www.screenulator.com website for existing subscribers, see website for more member benefits.
Recent Additions:
Candlestick Pattern Scanner: http://www.screenulator.com/show_video.php?id=-XCcw46omgs
Indicator Reliability Lab:
About Trendlines:
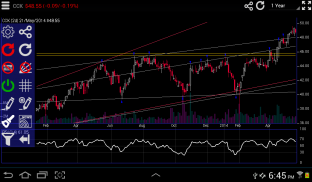
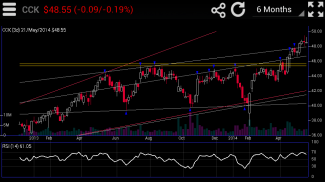
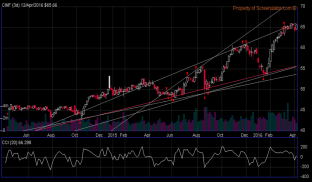
A trend line is a bounding line for the price movement of a security. A support trend line (or a bottom line) is formed when a securities price decreases and then rebounds at a pivot point that aligns with at least two previous support pivot points. Trendlines are considered by many expert traders to be the single most important tools in technical analysis. However, Support and Resistance breakout and Triangle patterns are just example of patterns formed by trendlines. This app automatically draws and screens for stocks with specific patterns.To learn more: http://www.screenulator.com/cgi-bin/v?pid=ref#trendlines
About Trend Reversal Indicator:
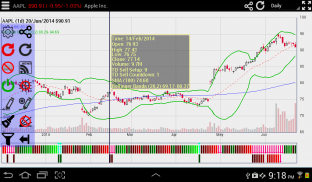
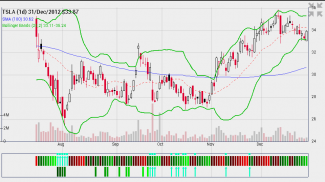
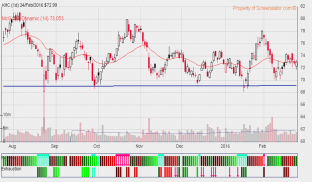
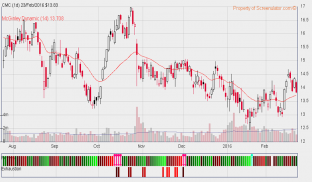
Screenulator's patent pending Trend Reversal and Exhaustion indicators combines 9,13 counting with trendline analysis to pinpoint trend pivots with color coded visual indicator. It has been shown to have an impressive record of identifying and anticipating turning points across the FX, bond, equity and commodity markets. Furthermore, the indicators provide signals not only on a daily chart but also intraday. It identifies when a trend is becoming, or has become, exhausted. This apps automatically identifies Trend Reversal, Trend Exhaustion, and Perfection criteria. It also calculates stoploss levels. To learn more: http://www.screenulator.com/show_video.php?id=TR_EXAMPLES
http://www.screenulator.com/cgi-bin/v?pid=ref#reversal
Classic TA indicators and overlays: RSI, MACD, SMA, EMA, Bollinger, Keltner band, Donchian Channel, Parabolic SAR, Ichimoku Cloud, McGinley Dynamic, SuperTrend, stochastic, ADX, Aroon, Chaikin, Ultimate, MFI, OBV, ATR, ADL, CCI indicators. Fibonacci Retracement and text annotation tools. Others will available upon requests.
Note: This app is free trial for 2 weeks or 100 usages whichever comes first.
Instruction Manual: http://www.screenulator.com/ischarts_faq.html
Desktop version: http://www.screenulator.com/ischarts_desktop.html
Annoucement: la v2.81 include una nuova fonte di dati per AlphaVantage per i dati di mercato internazionali.
Nuovo!! Aggiunta del software Relay Scanner e Indicatore di Candlestick per consentire il backtesting istantaneo!
Interactive Stock Charts © è l'applicazione di analisi delle scorte più intuitiva e avanzata. Puoi regolare liberamente l'intervallo di tempo e visualizzare le informazioni tecniche con il tocco delle dita: scorri, fai una panoramica e ingrandisci le splendide carte a candele con il controllo dei gesti e del tocco. Scorri per scorrere nell'analisi cronologica, pizzica per ingrandire e modifica l'intervallo di tempo, tocca i punti di prezzo per mostrare le quotazioni dettagliate e i valori degli indicatori tecnici. È anche possibile effettuare ordini di compravendita reali direttamente dai grafici e dalla vista del portafoglio, tramite il nostro partner Trader Brokerage per le azioni e le opzioni statunitensi. Supportato dal modello di grafico automatizzato in attesa di brevetto dello Screenulator e dal motore di riconoscimento della linea di tendenza, e primo screener di completamento indicatore 9,13 del settore! Interactive Stock Charts include anche un potente set di strumenti di analisi tecnica, Indicator Reliability Lab - strumento di backtesting in-chart e feed di notizie RSS in tempo reale per darti un vantaggio sul mercato!
Utilizzando algoritmi di Apprendimento Intelligente delle Reti Neurali basati sull'intelligenza artificiale, lo Screenulator rileva schemi grafici altamente proficui e trendline affidabili, segnali degli indicatori TR / TD e schemi di candele. Backtestato con oltre 50 anni di big data storici, ti assicura sempre un vantaggio nei confronti di mercati sempre più imprevedibili! Tutti i modelli di grafici Screenlet sono disponibili sul sito web www.screenulator.com per gli abbonati esistenti, vedere il sito Web per ulteriori vantaggi per i membri.
Aggiunte recenti:
Candlestick Pattern Scanner: http://www.screenulator.com/show_video.php?id=-XCcw46omgs
Indicator Reliability Lab:
Informazioni sulle linee di tendenza:
Una linea di tendenza è una linea di confine per il movimento dei prezzi di un titolo. Una linea di tendenza di supporto (o una linea di fondo) si forma quando un prezzo di titoli diminuisce e poi rimbalza in un punto di rotazione che si allinea con almeno due precedenti punti di snodo di supporto. Le linee di tendenza sono considerate da molti trader esperti come gli strumenti più importanti nell'analisi tecnica. Tuttavia, i modelli Breakout e Triangolo di supporto e resistenza sono solo esempi di modelli formati dalle linee di tendenza. Questa app disegna e seleziona automaticamente gli stock con pattern specifici. Per ulteriori informazioni: http://www.screenulator.com/cgi-bin/v?pid=ref#trendlines
Informazioni su Trend Reversal Indicator:
Gli indicatori Trend Reversal and Exhaustion in attesa di brevetto dello Screenulator combinano 9,13 contatori con analisi della linea di tendenza per individuare i perni di tendenza con indicatore visivo codificato a colori. È stato dimostrato di avere un impressionante record di identificazione e anticipazione dei punti di svolta nei mercati di valute, obbligazioni, azioni e materie prime. Inoltre, gli indicatori forniscono segnali non solo su un grafico quotidiano ma anche su intraday. Identifica quando una tendenza sta diventando, o è diventata, esaurita. Questa app identifica automaticamente i criteri di Reversione tendenza, Tendenza esaurimento e Perfezione. Calcola anche i livelli stoploss. Per saperne di più: http://www.screenulator.com/show_video.php?id=TR_EXAMPLES
http://www.screenulator.com/cgi-bin/v?pid=ref#reversal
Indicatori TA e overlay classici: RSI, MACD, SMA, EMA, Bollinger, banda Keltner, canale Donchian, SAR parabolico, Ichimoku Cloud, McGinley Dynamic, SuperTrend, stocastico, ADX, Aroon, Chaikin, Ultimate, MFI, OBV, ATR, ADL , Indicatori CCI. Fibonacci Retracement e strumenti di annotazione del testo. Altri saranno disponibili su richiesta.
Nota: questa app è di prova gratuita per 2 settimane o 100 utilizzi a seconda dell'evento che si verifica per primo.
Manuale di istruzioni: http://www.screenulator.com/ischarts_faq.html
Versione desktop: http://www.screenulator.com/ischarts_desktop.html


